I spent a year writing about one industry from the same profile. Most of what I published was written for my own audience: founders and CEOs of Seed through Series C cybersecurity companies, the rest of the leadership team involved in go-to-market, and my fellow cybersecurity marketers. A handful of posts shared content from my employer at the time and were aimed at the security buying teams that also make up part of my network. One post reached 27,145 people. The next one, published a week later on a closely related subject, reached 540. My follower count grew 37% over the same twelve months, and my typical post still reached a few hundred people, the same as it did at the start.
That felt random. It is not.
Earlier this month I was named to the Top 50 GTM Women Voices of the US for 2026, a list curated by N.Rich with a jury of senior go-to-market leaders. I am grateful for it, and I also wanted to understand it. A recognition like that is a signal that something in how I write about go-to-market is landing with the people who matter, and a signal is only useful if you know what produced it. I run marketing the same way I run everything else: instrument first, then decide. So I treated my own presence the way I would treat a client’s pipeline. I pulled the full analytics export, classified every post, and read what LinkedIn’s own engineers published about the new feed, then cross-checked it against the largest independent studies of the platform.
Three questions drove the work. Where could I get more reach without diluting what earned the recognition? How do I keep amplifying a voice that has clearly found an audience? And what do I need to learn about how distribution actually works now, so that the founders, executives, and companies I work with get the benefit of it too, in their own reach and their own voice. Here is what the data says, and what I am changing because of it.
Quick answers
Why do some LinkedIn posts reach thousands of people while others on the same topic reach a few hundred?
LinkedIn no longer distributes posts by follower count. Since the March 2026 feed rebuild, the ranking model reads what a post is about, predicts whether specific members will stop, read, and respond, and expands reach only when a small test audience does exactly that. In my own data, 3 of 26 posts produced 64% of a year’s impressions, reach tracked posting frequency rather than follower growth, and the topic of a post set its ceiling before a single person saw it. Visibility comes from one clear topic lane, a steady cadence, a first line worth stopping for, and the first 90 minutes after publishing.
What my own numbers showed
The export covers September 2025 through September 2026: 63,887 impressions, 37,416 members reached, 26 posts published in the window, and a follower count that moved from roughly 4,600 to 6,341.
1. Reach is a power law, not a baseline
Three posts produced 64% of the year’s impressions. The median post reached 596 people. Eighteen of twenty-six never cleared 1,000.
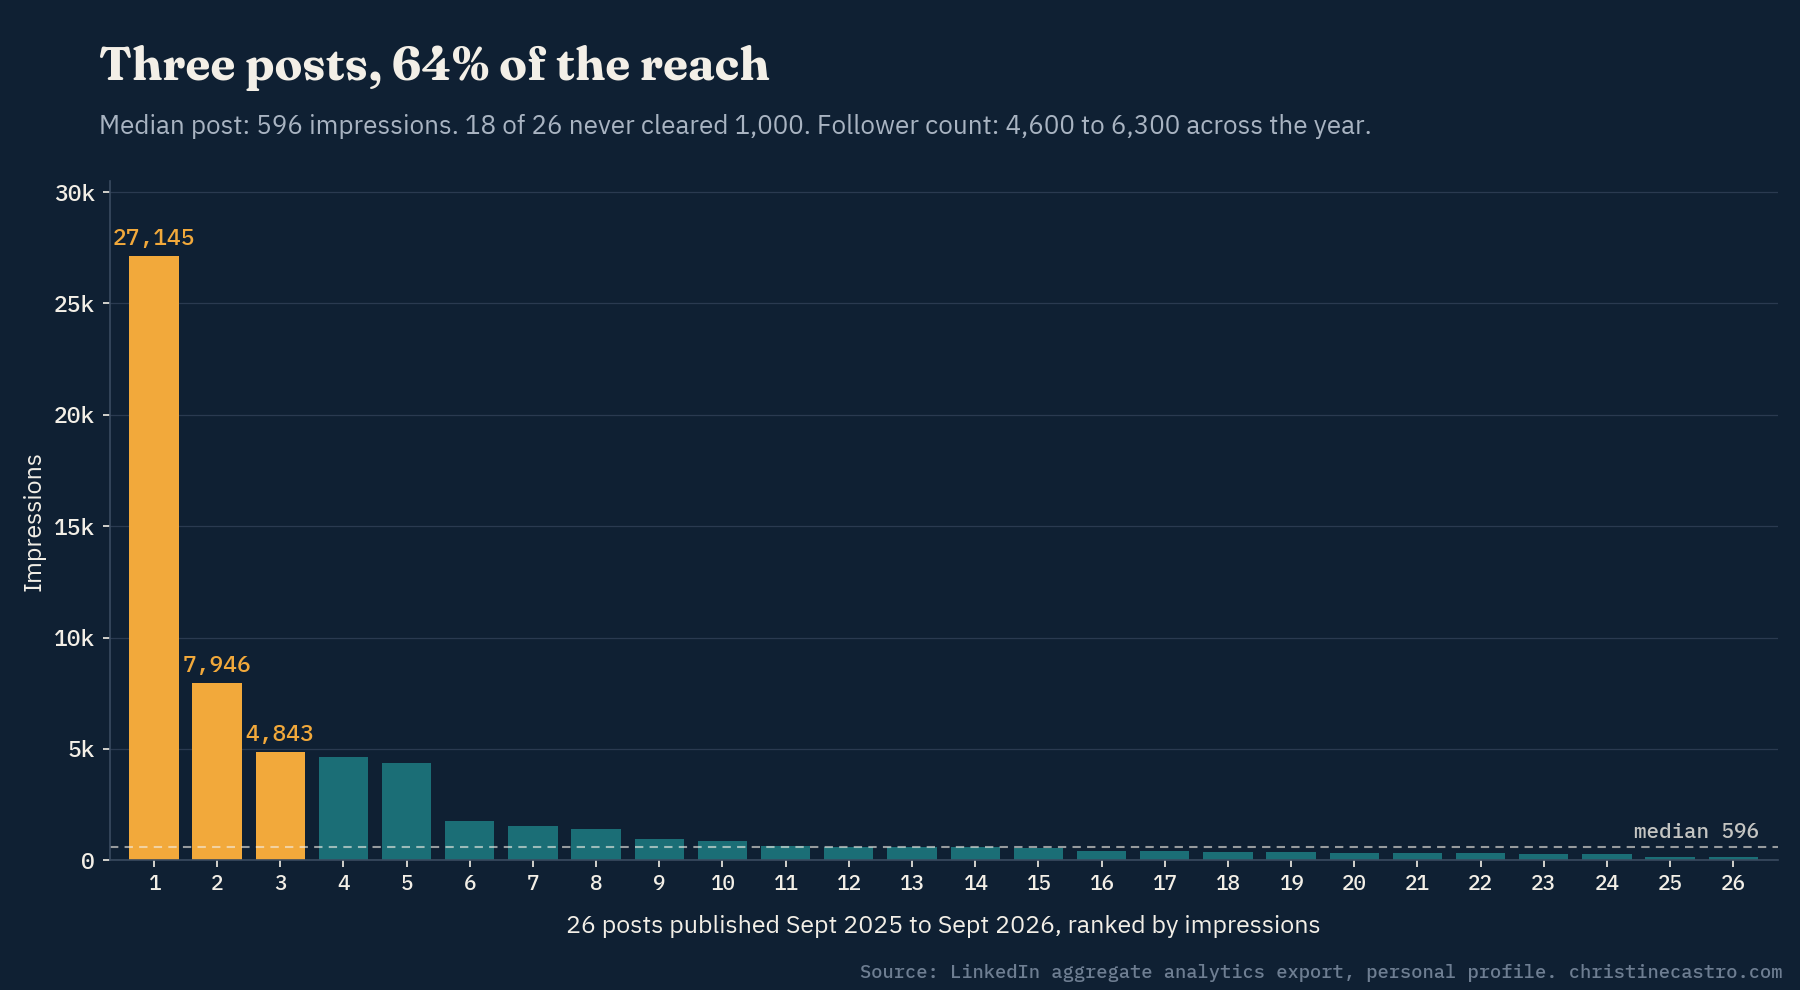
If you have ever felt that LinkedIn is either ignoring you or suddenly paying attention, this is why. There is no steady middle. A post either passes its early test and gets pushed to people outside your network, or it stays in a pool of a few hundred and stops.
2. Followers grew without content, so they taught the algorithm nothing
For eight months I posted one to three times a month, and in two of those months I did not post at all. Followers kept arriving anyway, about 85 a month.
I was not absent during that stretch. I was commenting on other people’s posts regularly, and I would guess that is where a good share of those followers came from: someone reads a comment, visits the profile, follows. The problem is that I cannot prove it, and neither can you. LinkedIn Premium will give you a list of everything you have commented on, but each entry shows only the impressions that comment earned. There is no aggregate view, no export, and no line connecting a comment to the profile visits, follows, or post engagement it produced. Commenting is real work with real effects, and the platform’s own analytics treat it as invisible.
What the data can show is this: those new followers arrived without seeing a post from me, so they never reacted to one, and never gave LinkedIn a single signal that they wanted my content in their feed. A follower earned through a comment is a person. To the ranking model, they are a blank row until your own posts give them something to respond to.
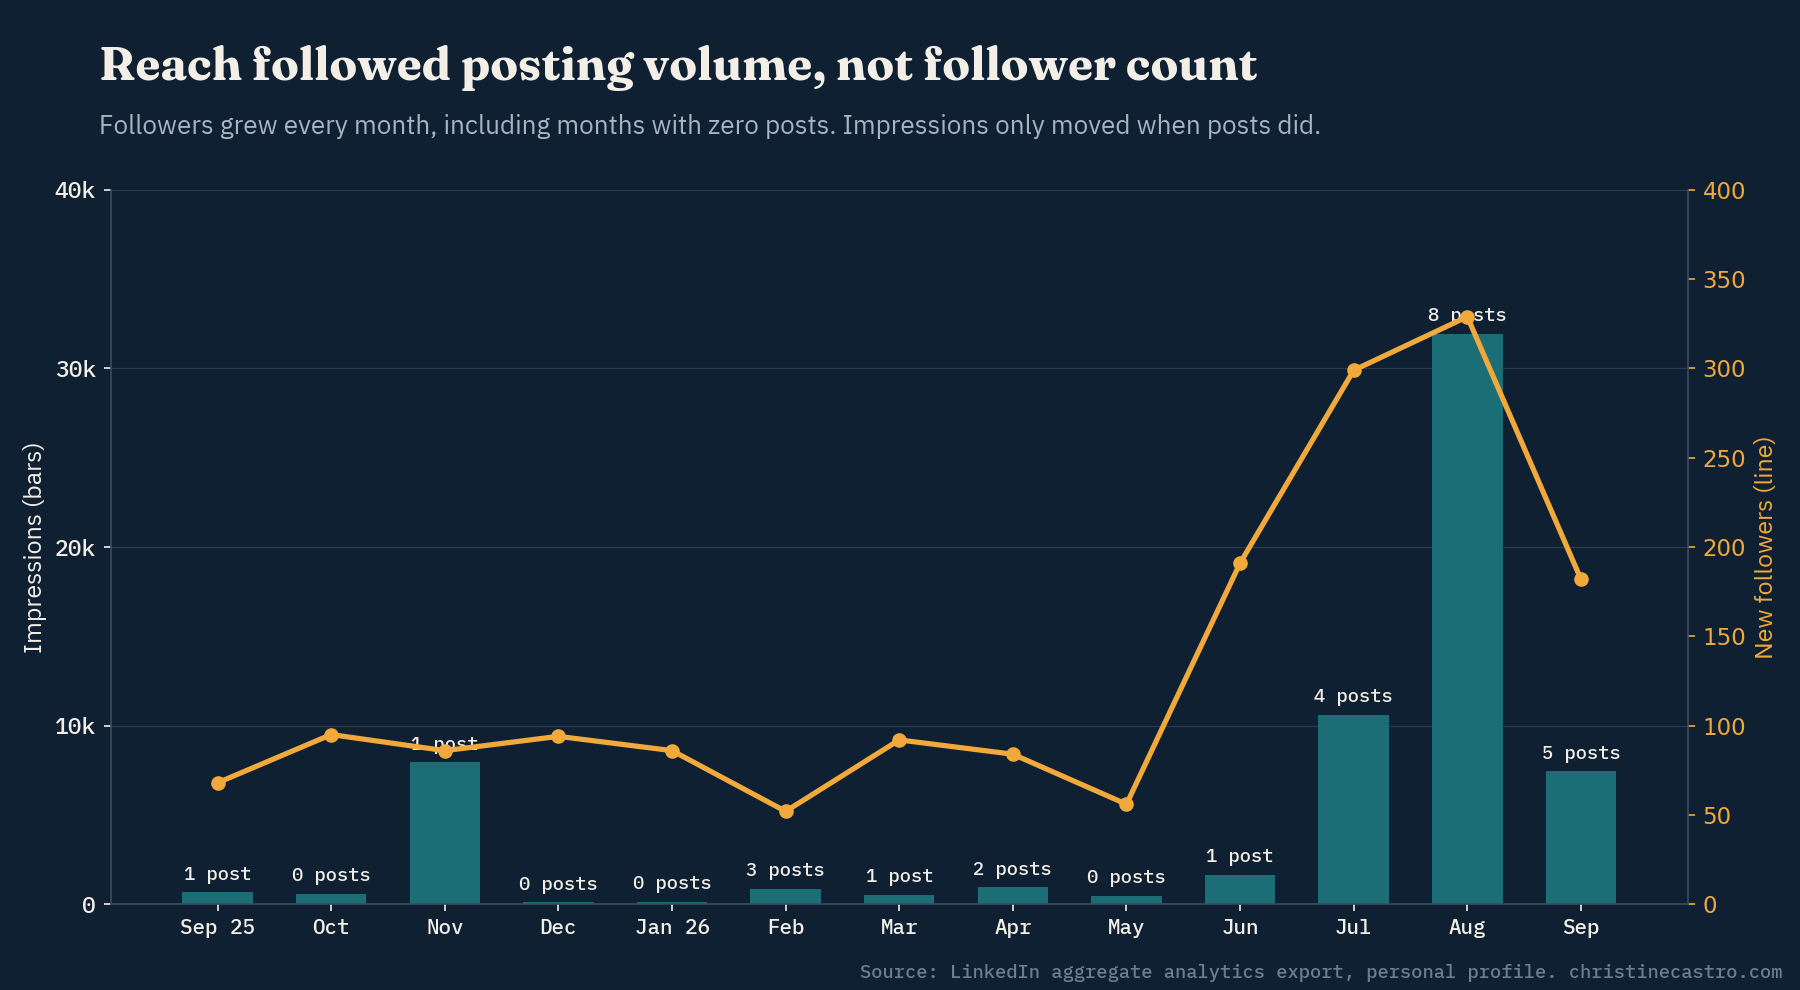
The correlation between posts published per month and impressions was 0.87. Median reach per post moved from roughly 425 to roughly 600 across the year, and all of that movement arrived with the shift to weekly posting in July, not with the follower curve. In that same shift, monthly impressions rose 20 times over the spring average and follower growth tripled to roughly 300 a month. Reach drove followers. Followers did not drive reach.
3. The topic set the ceiling before anyone read the post
I grouped every post into a lane. Same author, same year, same writing quality by any honest measure. The medians told a very different story by subject.
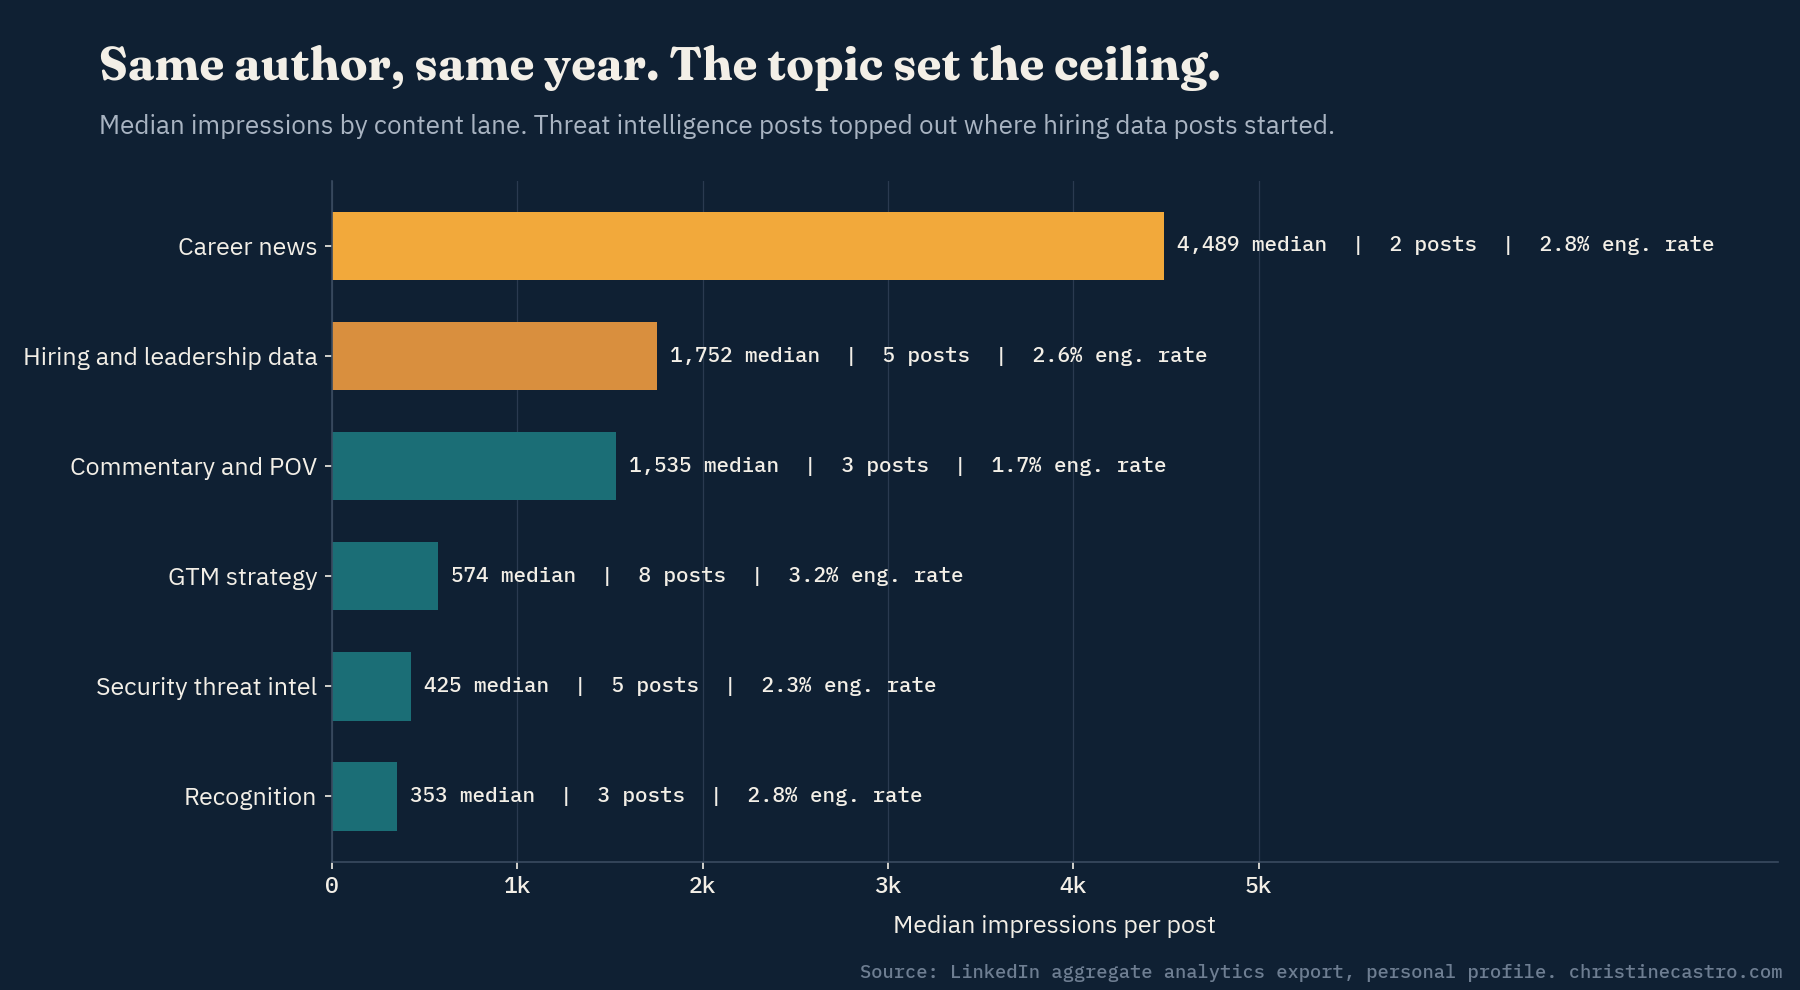
The threat intelligence posts I shared on behalf of my employer, written for security buying teams, topped out around 425 impressions no matter how well they performed on engagement rate. Posts written for my own audience about marketing leadership hiring, backed by data from a job board I built, started at 1,752 and ran to 27,145. Neither audience is wrong. The pool of members LinkedIn associates with cybersecurity marketing leadership and go-to-market is simply far larger than the pool it associates with executive digital exposure, and the model distributes into the pool it can find. A post written for a narrow buying committee will reach a narrow buying committee, which is the point of it, and the impression count should be judged on that basis.
4. The biggest post reached a different audience than it was written for
The 27,145-impression post had the lowest engagement rate of anything I published over 100 impressions: 0.57%. The content demographics explain it. The post was a data point about marketing leadership hiring, aimed at the founders and CEOs who make those hires. It traveled instead into advertising services, marketing managers, and marketing directors: 18% of everyone who saw my content this year came from agency and marketing services roles.
That is not the wrong audience. A large part of what I write is meant to teach, and marketing managers and directors are exactly who I want reading a post about budget structure, pipeline coverage, or how to scope a hire. Several of my strongest engagement rates came from posts written for them. The issue is that this particular post was not written for them, so most of them scrolled past, and the model read the low dwell time as a weak signal. Reach and relevance came apart.
The lesson is about matching, not seniority. Every post has an intended reader. When the audience the model finds is the one the post was written for, engagement follows and distribution keeps expanding. When they diverge, you get a big number and a quiet room. For anyone using LinkedIn to be hired, to sell, or to be trusted, the scoreboard is whether the people the post was written for saw it, stayed, and did something next. Impressions alone cannot tell you that.
5. Opener style mattered more than posting day
Posts that opened in the first person, with a specific event or number, had a median of 1,644 impressions and a 3.5% engagement rate. Posts that opened with a general claim had a median of 425 and 2.0%. Posts that opened with hashtags landed in between. Day of week made no meaningful difference across 26 posts. The first line did.
What LinkedIn itself says is happening
On March 12, 2026, LinkedIn’s engineering team published the most detailed public description of its feed it has ever released, alongside a member-facing note from Tim Jurka on authentic, relevant conversations. Read together with the 2025 research paper that preceded them and LinkedIn’s earlier note on dwell time, four things stand out.
The feed reads meaning, not metadata. Retrieval now runs on a large language model that converts each post and each member profile into a representation of what they are about, then matches them. This is why a well-written post about a small topic reaches a small audience and a plain post about a large topic can travel. The model is matching subject to interest before it looks at anything else.
The ranker predicts specific actions. LinkedIn’s published work describes a model that predicts whether a given member will click, scroll past, stay on a post beyond a time threshold, react, comment, or share. The two it reports its gains on are long dwell and contribution. A post people read slowly and then respond to is the target. Everything else is downstream of that.
Memory is long but it decays. The system draws on roughly a year of a member’s interactions, and recent behavior counts more than older behavior. That is the mechanical reason a three-month gap hurts. The audience that engaged with you in November has faded from the model’s view of them by February.
Follower count is not the distribution lever. LinkedIn’s own framing is that the feed shows members what is useful to them, and its engineers describe matching content to interests and career goals rather than to connection graphs. Practitioners have summarized the same shift as the move from a social graph to an interest graph. My data agrees with both.
What the biggest voices agree on, and where they do not
Richard van der Blom’s Algorithm Insights research is the largest independent study of the platform, most recently drawing on 1.3 million posts from 50,000 creators. His headline finding is that reach for active creators is down roughly 60% over two years, and that this is by design, not by accident. LinkedIn would rather show a post to 500 people who will read it than 5,000 who will scroll.
Across his work, the Saywhat quarterly studies, and the practitioners who publish real data rather than opinion, several points are settled:
- The first 60 to 90 minutes decide the trajectory. A post is shown to a small test audience first. Meaningful early engagement, especially comments the author replies to, is what earns expansion.
- Topic consistency builds authority. Two or three pillars, posted about most of the time, aligned with the headline and About section. Building that association takes 60 to 90 days of steady publishing.
- Engagement bait and coordinated pods now cost reach. LinkedIn’s March 2026 update explicitly targeted them, and several analysts report that coordinated early engagement is detected and suppressed rather than rewarded.
- Hashtags are a lightweight topic signal, not a reach driver. The model reads the whole post. Opening with a row of hashtags wastes the one line that matters most.
- Specific beats generic. Stories with a real detail in the first line and posts with a clear point someone could disagree with outperform safe consensus. Analysts attribute the reach decline for generic AI-drafted content to low dwell time, not to any detection of how it was written.
Two things remain contested, and it is worth continued testing on each poster’s end:
- External links. Van der Blom’s 2026 data shows a link in the body reduces median reach by about 19%, and he reports that comments containing links are now suppressed as well. Saywhat’s Q1 2026 analysis of nearly 400,000 posts found the opposite: link-heavy posts outperformed, which the researchers attributed to those posts being useful resource lists. My hypothesis is that a link is not punished on its own; a link that pulls readers off the platform before they finish reading collapses the dwell and contribution signals the ranker is built to predict.
- Formats. Multi-image and document posts lead most engagement-rate benchmarks, but a June 2026 analysis of 147 B2B accounts found native text posts outperforming carousels on organic reach. Format is a smaller lever than topic and opener. Use the one that fits the idea.
What I am changing
These are aspirational goals, not a scorecard. Some weeks I will hit every one of them and some weeks I will not, and I am not going to penalize myself for a missed post or a slow reply when the direction is right. The point is the pattern over 90 days, not perfection in any given week.
- One lane. Cybersecurity marketing leadership and go-to-market, written for founders, GTM leadership teams, and cybersecurity marketers, with security expertise as the proof, not the subject. My headline and About section will say the same thing my posts say.
- Three posts a week for 90 days, no gaps. My best month was also my most consistent month. The November post that reached 7,946 people was followed by three months of silence, and every bit of that momentum was gone by February.
- Own the first 90 minutes. Publish Tuesday through Thursday in the morning, reply to every comment within the hour, and ask a handful of people I trust to add a real point of view rather than a compliment.
- A data series I own. The post that traveled furthest opened with a number about cybersecurity GTM leadership hiring. I already publish that data. GTM Radar scans open go-to-market roles across hundreds of pre-IPO cybersecurity companies every night, and the Hiring Landscape page aggregates the numbers across the board and shows them by date. That page is the series. The posts will draw from it on a monthly cadence.
- Links in the comments, never the body. Contested or not, nothing in my data suggests I lose anything by moving them.
- A new scoreboard. For each post, did the reader it was written for show up: comments and saves from marketers when I am teaching, profile views and messages from founders, CEOs, and board members when I am writing to them. Impressions are context, not the score.
- Build on what earned the recognition. The posts that put me on the Top 50 list were the ones where I brought data, a clear point of view on go-to-market, and a willingness to say something a room could argue with. That is the voice. The job now is to give it a steady cadence and a lane, not to change it.
- Keep learning the machinery. I am reading LinkedIn’s engineering publications and the independent studies as they land, and re-running this analysis every quarter. Understanding distribution is now part of the marketing leader’s job, whether the voice being amplified is mine, a founder’s, or a company’s.
Recommendations for marketers
If you are building a personal or executive presence on LinkedIn for a B2B company, the same rules apply, and the same trap is waiting. Here is the short version.
- Pick the lane your buyers are in, not the lane your product is in. A niche technical topic has a niche audience, and the model will find exactly that many people for it. Write about the problem your buyer owns.
- Post on a cadence the model can learn from. Two to three times a week beats one great post a month. Consistency is how the system builds its picture of who your content is for.
- Spend your effort on the first line. A specific event, a specific number, or a specific claim someone could argue with. Never a hashtag, never a greeting, never a question you already know the answer to.
- Write for the reader who stays. Long dwell is a stated objective of the ranker. Give people something worth reading to the end, then give them a reason to respond.
- Show up after you publish. Reply to every early comment with substance. Treat the first 90 minutes as part of writing the post.
- Move links to the first comment. Whatever the studies eventually settle on, a reader who leaves before finishing is a lost signal.
- Stop optimizing for impressions. Read the content demographics on your best-reaching post and compare them with who you wrote it for. If they match, build on it. If they do not, the number is flattering you.
- Audit quarterly, and log what LinkedIn will not. Export your analytics, classify posts by lane and opener, and look at medians rather than peaks. The outliers will lie to you. The medians will not. Then keep your own record of the work the export cannot see: which posts you commented on, when, and what followed in profile views and follows over the next two days. It is a spreadsheet and ten minutes a week, and it is the only way to know whether the commenting is paying for itself.
None of this requires a bigger audience. It requires being clear about who you are writing for and showing up for them often enough that the system, and the people, learn to expect you.
That is also why I did this work in the open. Being named one of the Top 50 GTM Women Voices was a reason to look harder at my own numbers, not a reason to stop. The same discipline that made the list possible is the one I bring to a client’s pipeline or an employer’s category: understand what is producing the result, protect it, and build on it deliberately. If I can help a founder or a marketing team find their own lane and get heard in it, the analysis above is a good place to start the conversation.
Sources
- LinkedIn Engineering, Hristo Danchev, Engineering the next generation of LinkedIn’s Feed, March 12, 2026.
- Tim Jurka, LinkedIn, Updates to The LinkedIn Feed Focusing on Authentic, Relevant Conversations, March 12, 2026.
- LinkedIn Engineering, Understanding dwell time to improve LinkedIn feed ranking.
- Richard van der Blom, Algorithm Insights Report, 2025 and 2026 editions, and his June 2026 conversation with Jay Clouse on Creator Science.
- Fast Growth Advisors, LinkedIn Algorithm 2026: the white paper, a careful read of what LinkedIn has and has not actually published.
- Saywhat, Will McTighe and Chris Donnelly, State of the Algorithm, Q1 2026, 397,605 posts analyzed.
- Markana Media, LinkedIn Algorithm Update June 2026: B2B Reach, 147 B2B accounts.
- Dataslayer, LinkedIn Algorithm 2026: What Works Now, format engagement benchmarks.
- Firooz et al., 360Brew: A Decoder-only Foundation Model for Personalized Ranking and Recommendation, arXiv, January 2025 (since withdrawn from arXiv; readable mirror linked).
- N.Rich, GTM Women Voices Awards, US Edition 2026.
- My own LinkedIn aggregate analytics export, September 17, 2025 to September 16, 2026, and the hiring data behind GTM Radar on christinecastro.com.